

Sustainability Monitoring
This page displays data related to the Sustainability Index (SI). Both the time range for the analysis and the data granularity can be configured by the user.
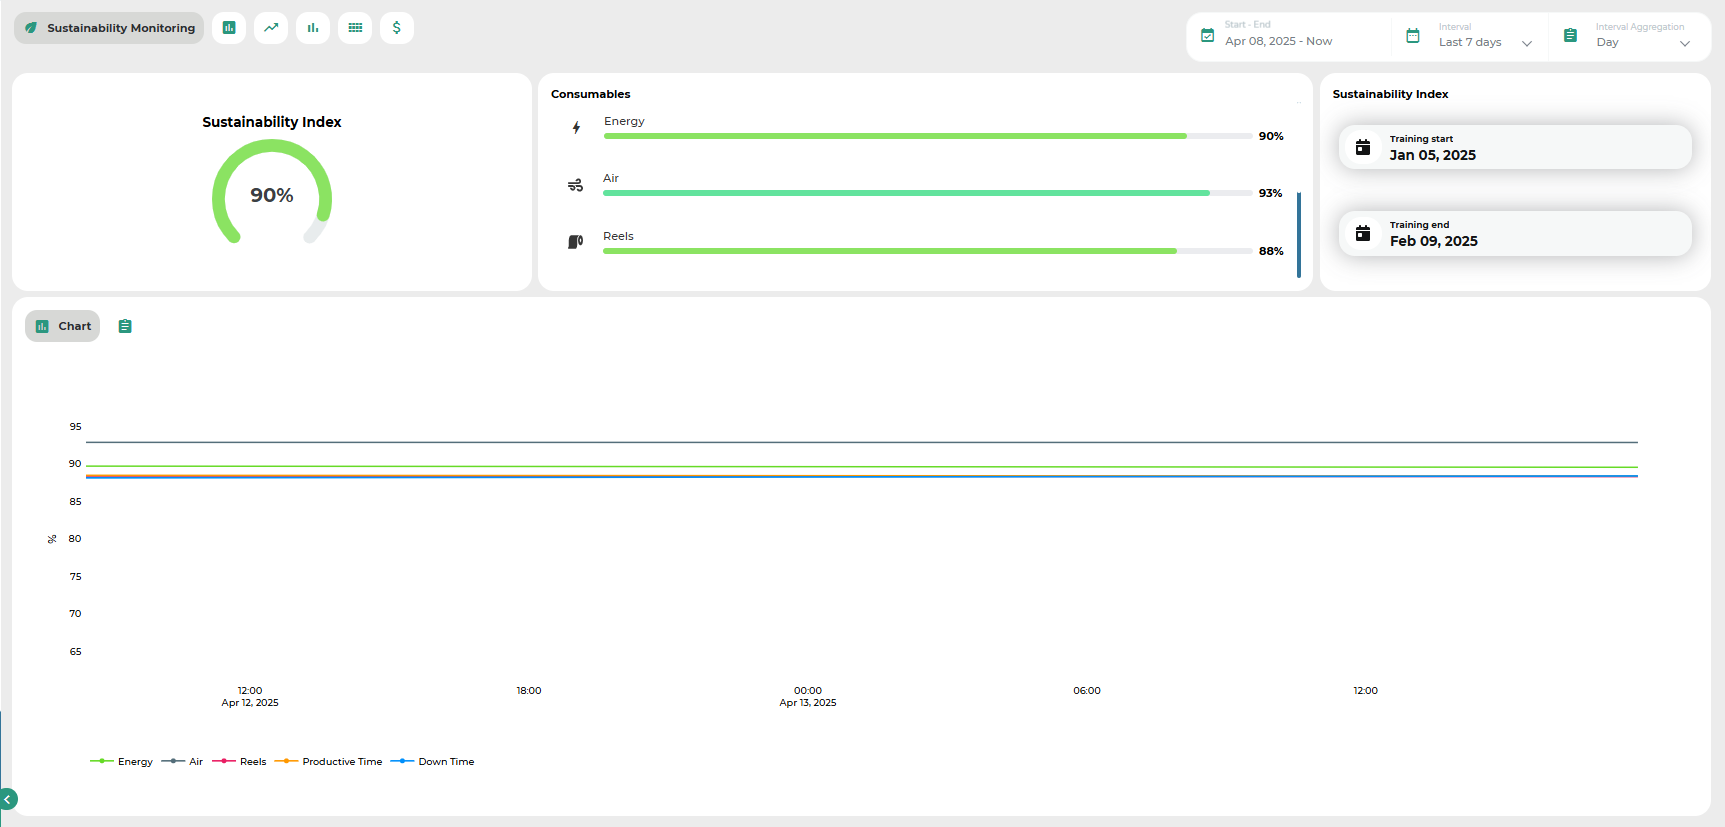
At the top of the page, the overall SI value is shown as a percentage, calculated as the average of the individual SI values for each consumable. Each of these individual values is also displayed in percentage format. The page also indicates the time period used to train the model underlying the calculations.
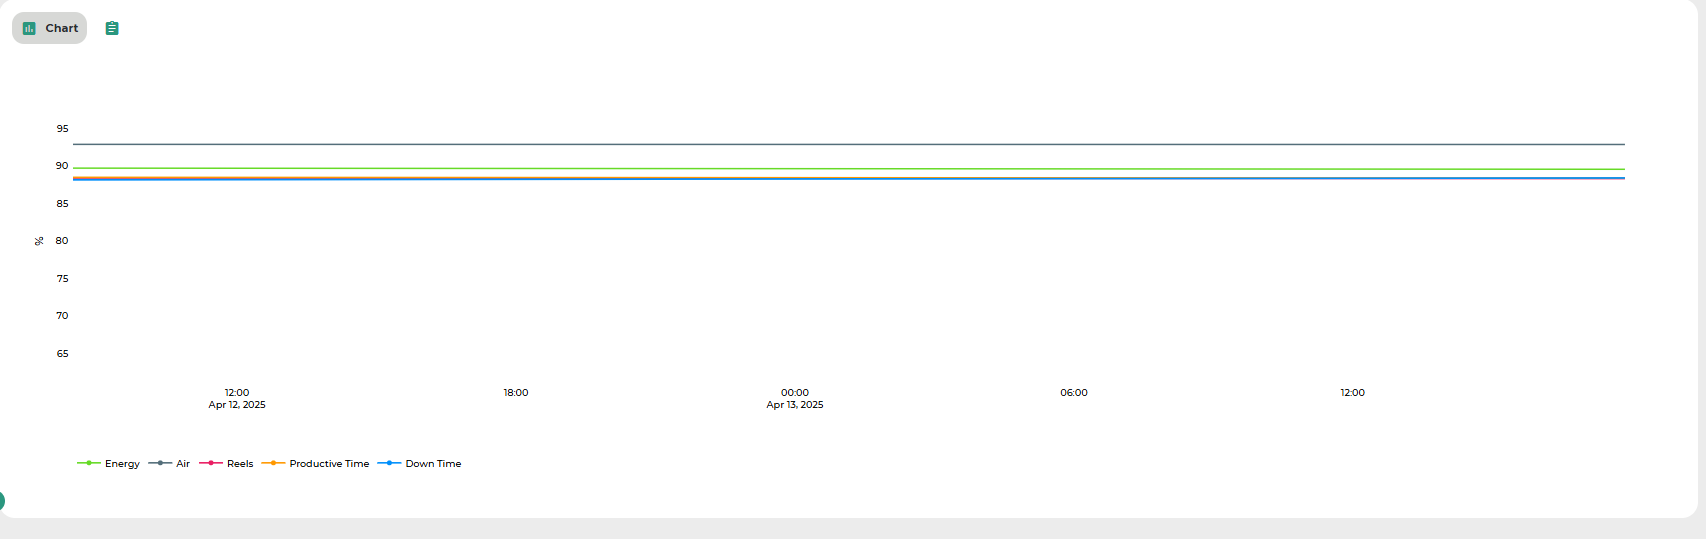
The chart in the lower section of the page illustrates the trend of the SI for each consumable over time, with its granularity depending on the user's settings. Hovering over each line reveals detailed information for that specific data point.
Was this helpful?