

Cost Trend
This module provides all the necessary information for a comprehensive cost analysis related to the production of the selected machine.
On the right-hand side, users can select the Time Interval and the Temporal Aggregation level for the analysis.
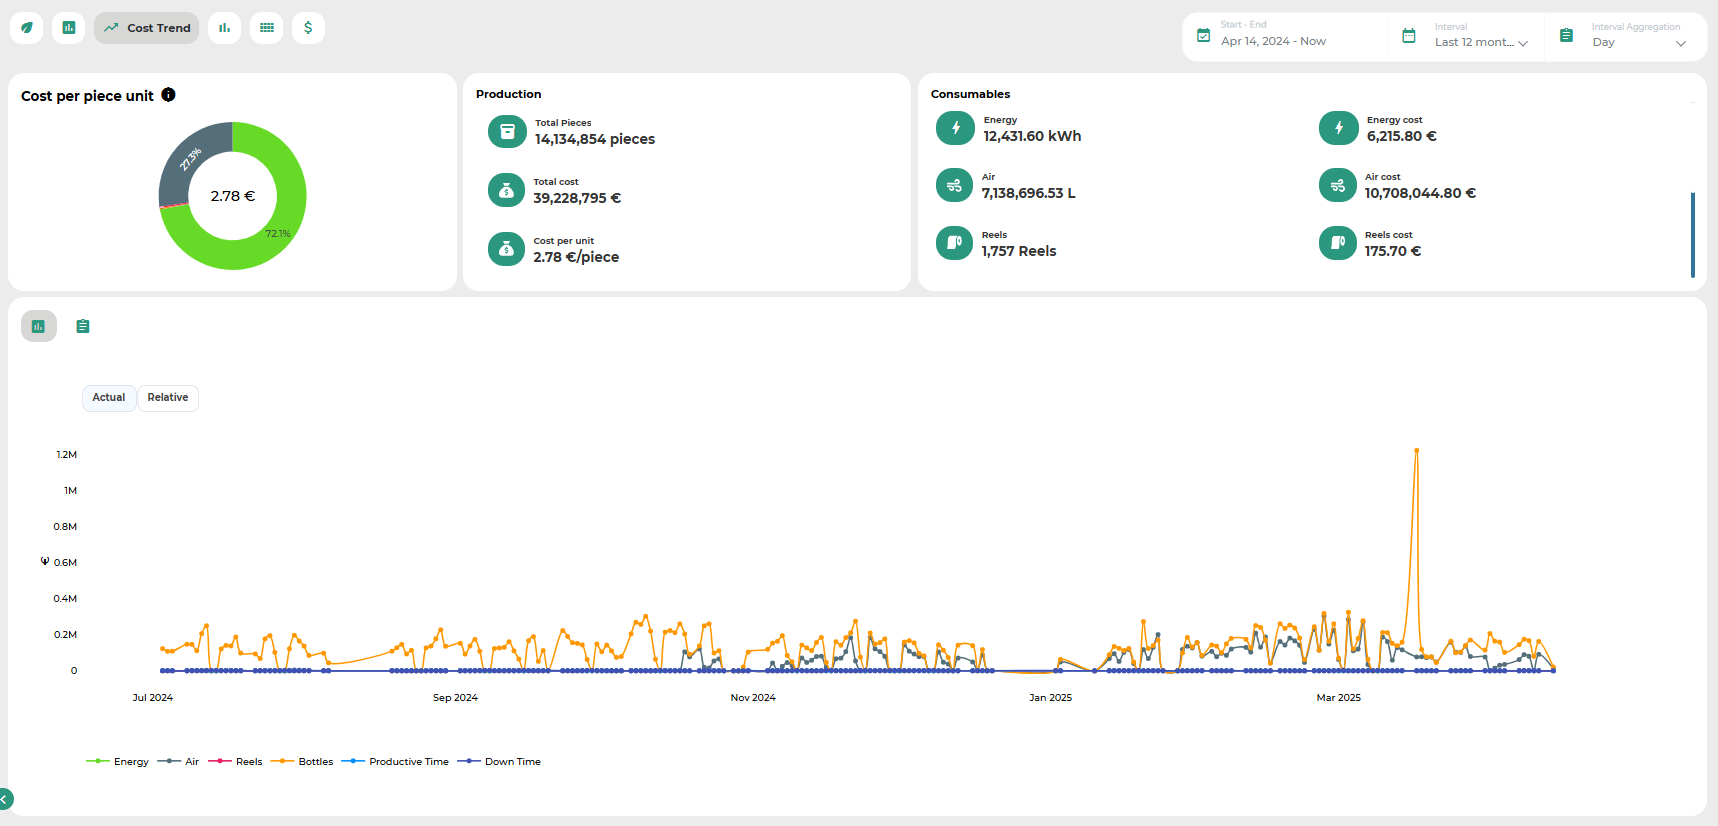
At the top of the screen, three panels display the following information:
Cost per Unit (e.g., kilo): A donut chart summarizing production costs per unit. The chart shows the percentage contribution of each consumable to the final cost.
Production: General information about total production, including the number of units produced, total production cost, and cost per unit.
Consumables: A list of all consumables considered in the analysis. For each item, the quantity used and the unit cost are displayed.
Please note that the production unit can be customized for each project. Common examples include piece, kilogram, or meter—resulting in metrics such as cost per piece, cost per kilogram, or cost per meter.
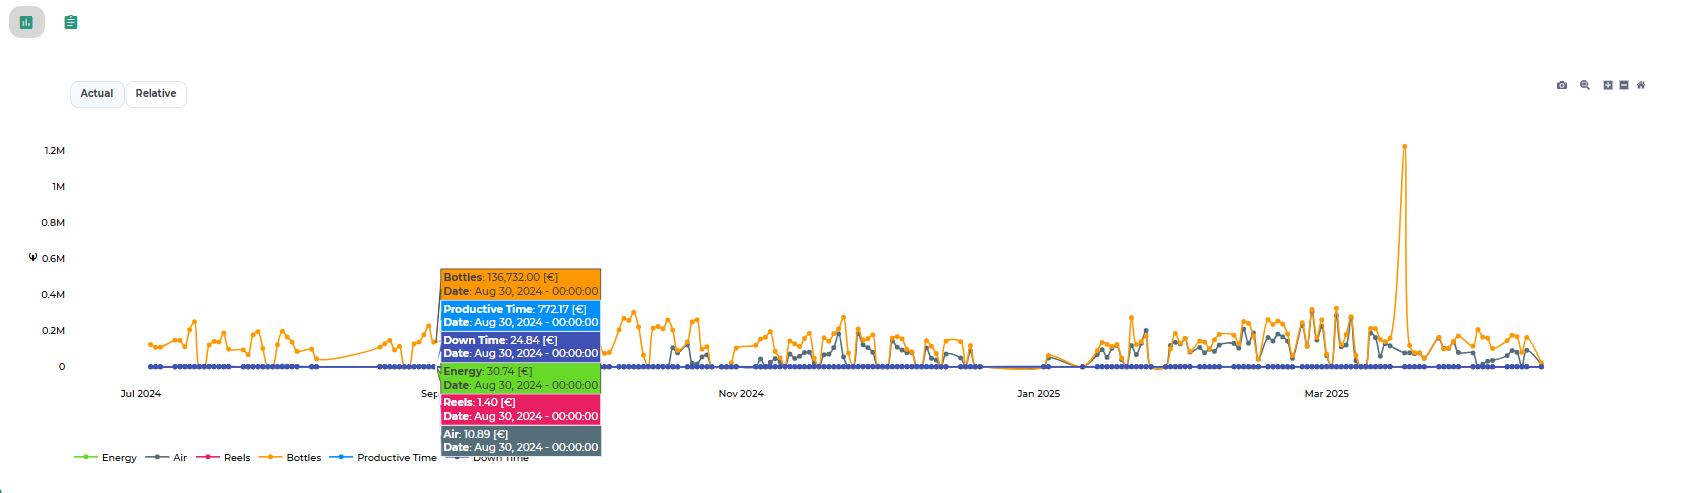
At the bottom of the screen, a chart displays the cost trend over time for each consumable. The chart’s granularity is determined by the previously selected aggregation setting. Hovering over the graph reveals detailed tooltips for each data series.
Was this helpful?