

Cost Pareto
This page displays detailed information on the cost of each consumable, with a particular focus on the total cost incurred based on the quantities used.
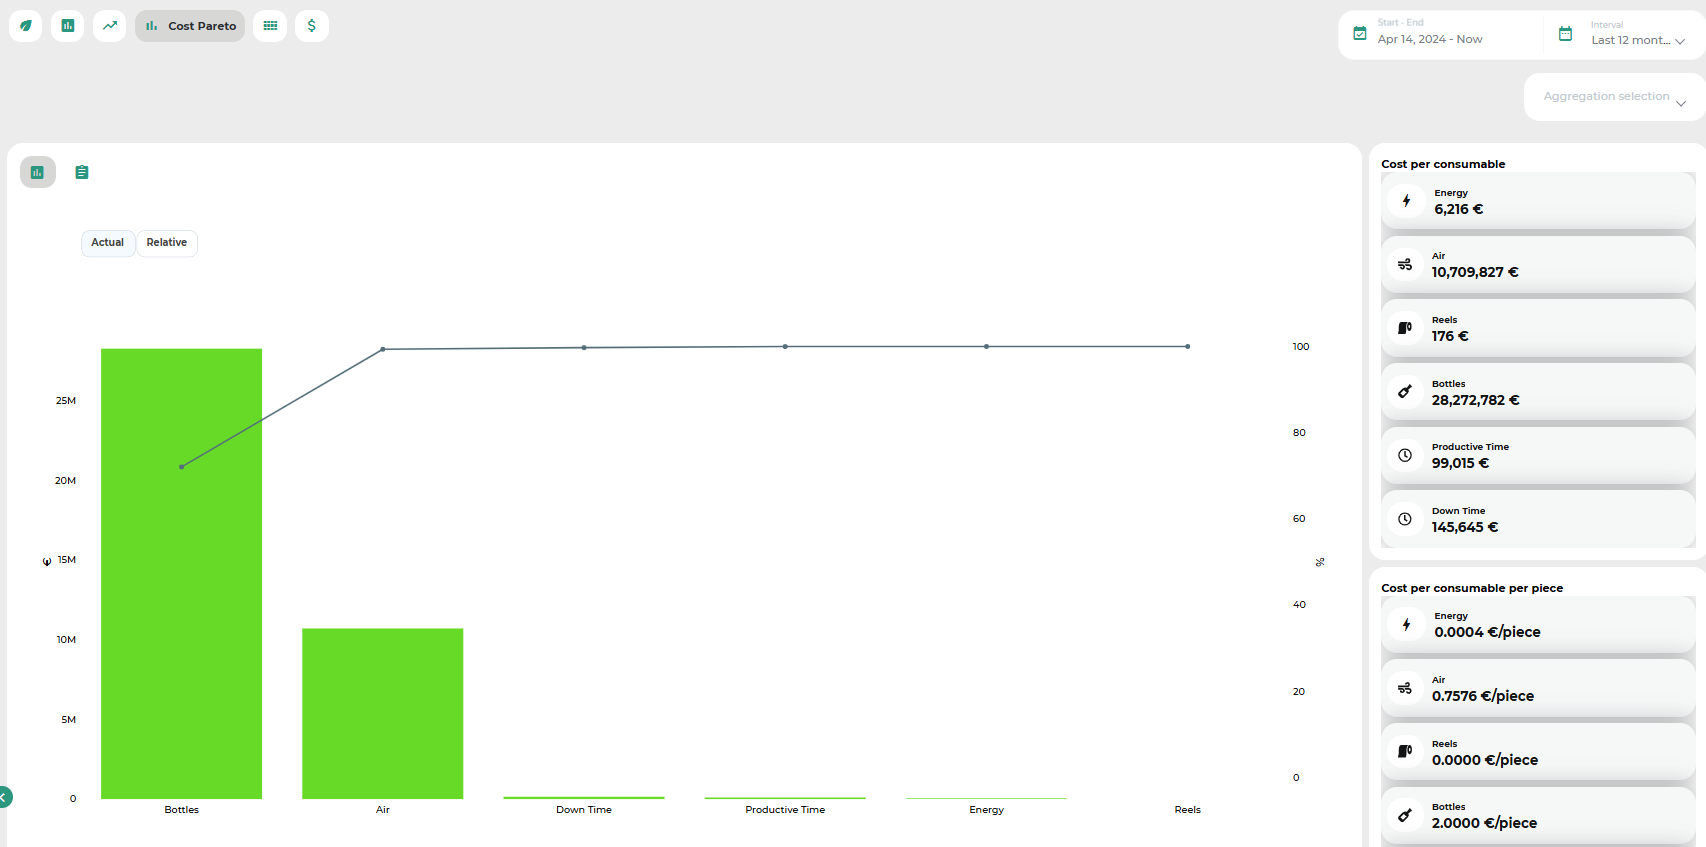
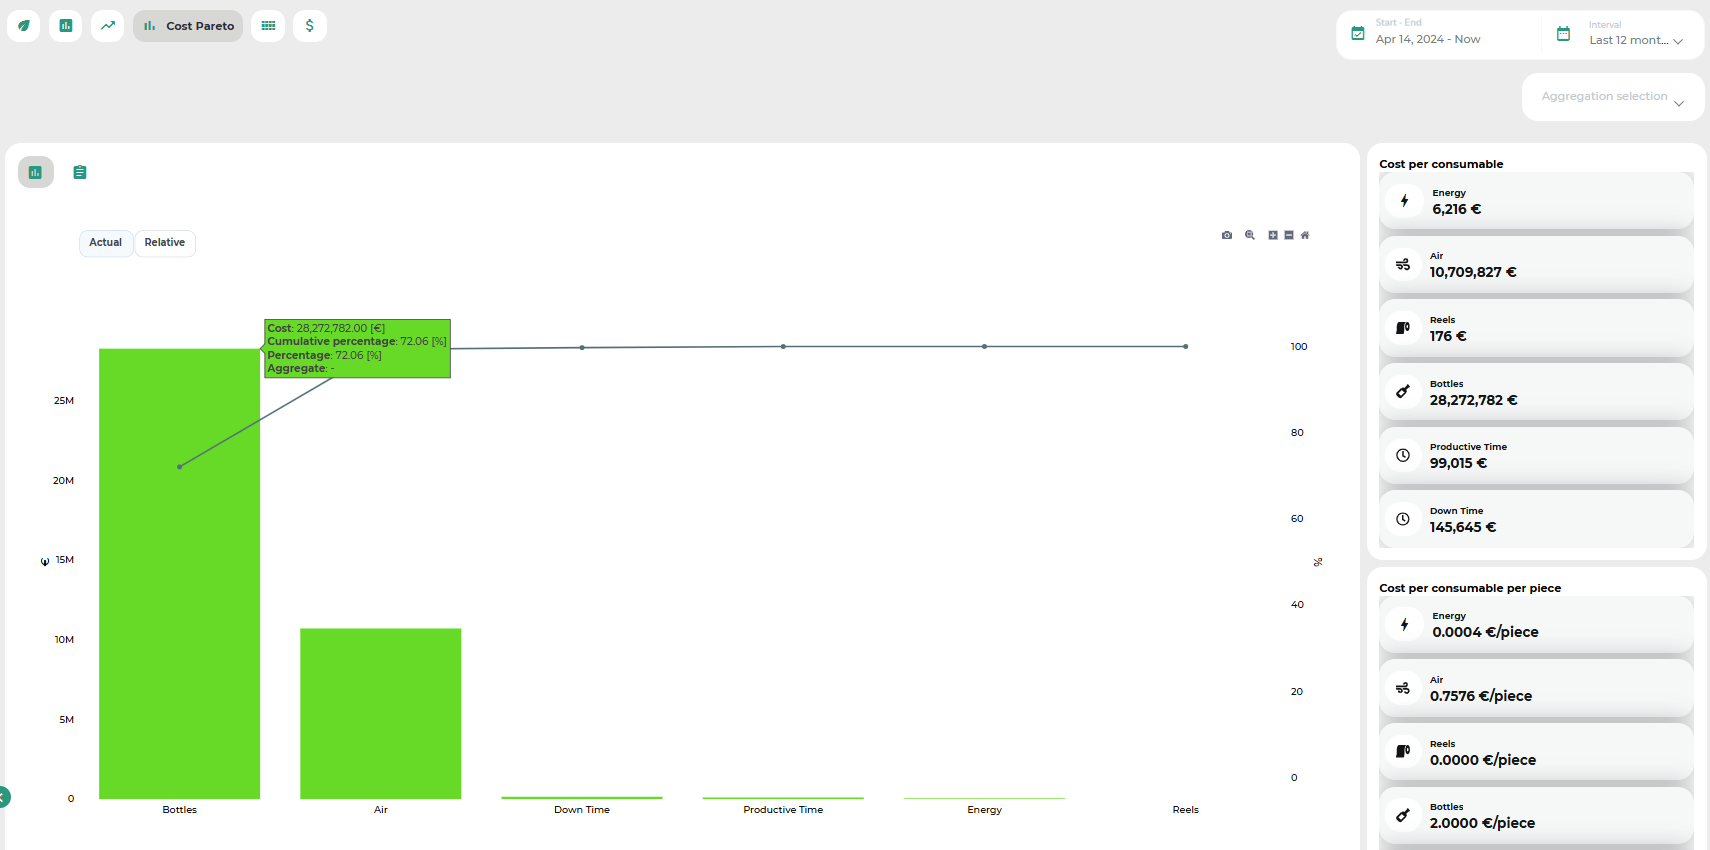
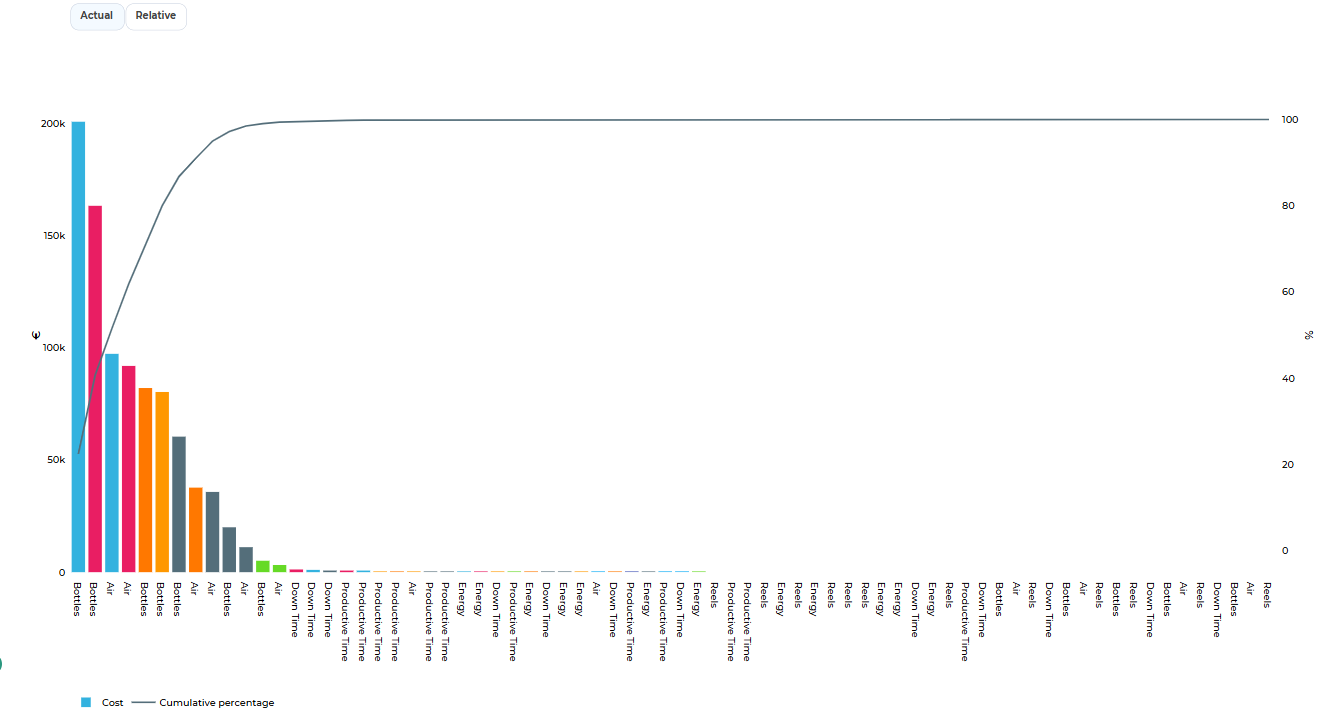
A Pareto chart visually highlights the cost impact associated with the use of each consumable. By hovering over the bars, detailed tooltips provide additional information for each item.
On the right-hand side of the page, users can select both the Time Interval for the analysis and the Data Aggregation Method.
Was this helpful?