Charts
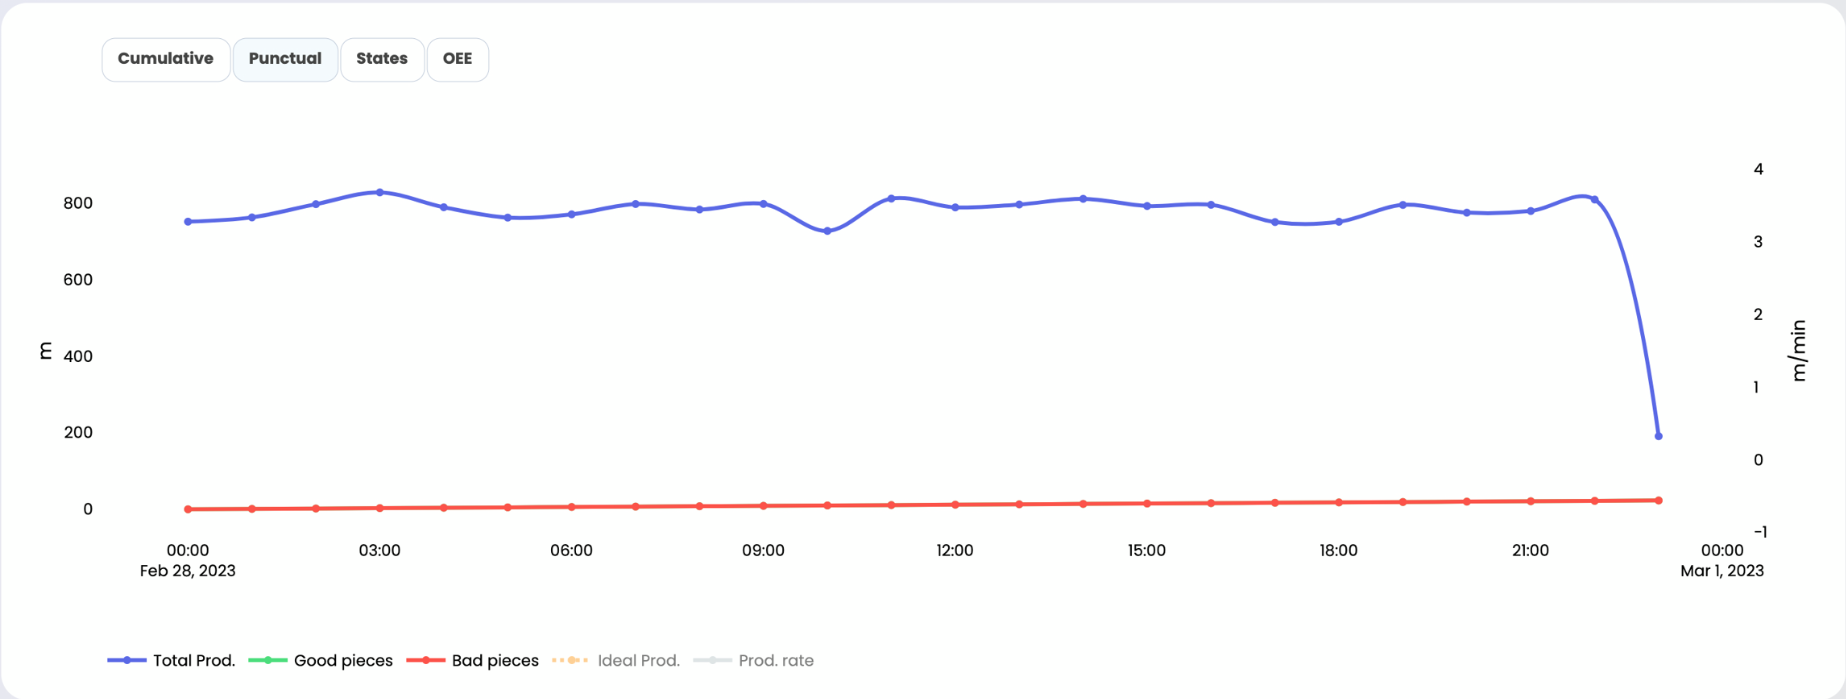
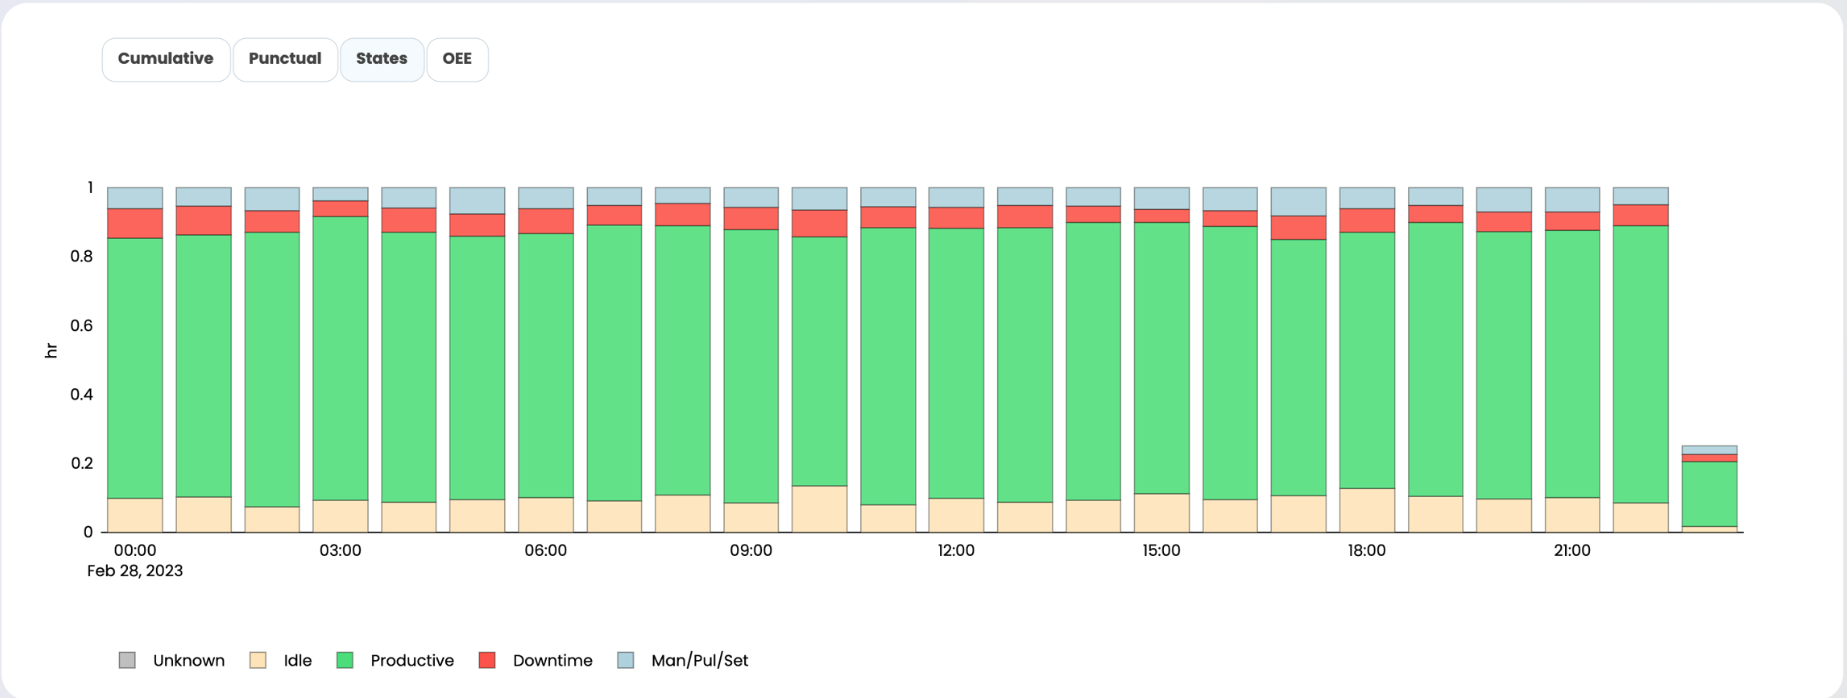
When hovering over any graph within the web application, whether it's a line, bar, cumulative, or point graph, the corresponding data points are displayed.
At the top right of each graph, there are icons that provide additional functionalities. The zoom icons allow you to zoom in or out on the graph. The house icon allows you to reset the zoom level to its original state. Furthermore, you have the option to save the graph as a PNG image using the respective icon.
Alternatively, you can also zoom into specific areas of the graph by dragging the mouse over the desired region.
Moreover, below the graph, there is a legend that lists variables associated with the data. By selecting or deselecting these variables, you can isolate specific data represented in the graph. The arrows in the figure indicate the location of the legend.


Was this helpful?

