

Sustainability Analysis
This page provides an analysis based on Sustainability Indexes (SI) and the production costs of the finished product.
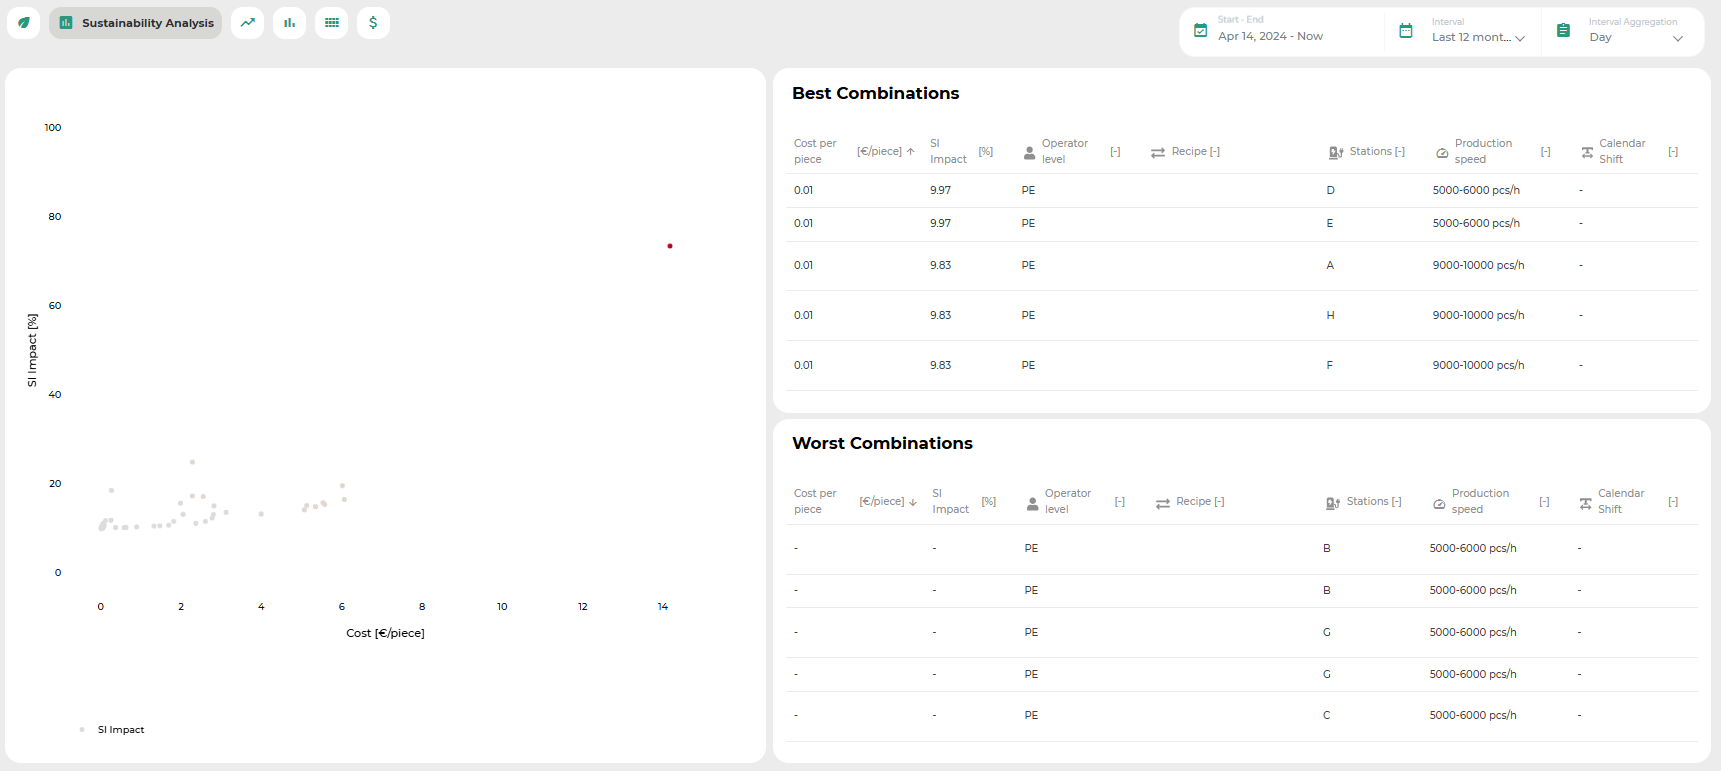
The analysis can be performed over a time period selected by the user.
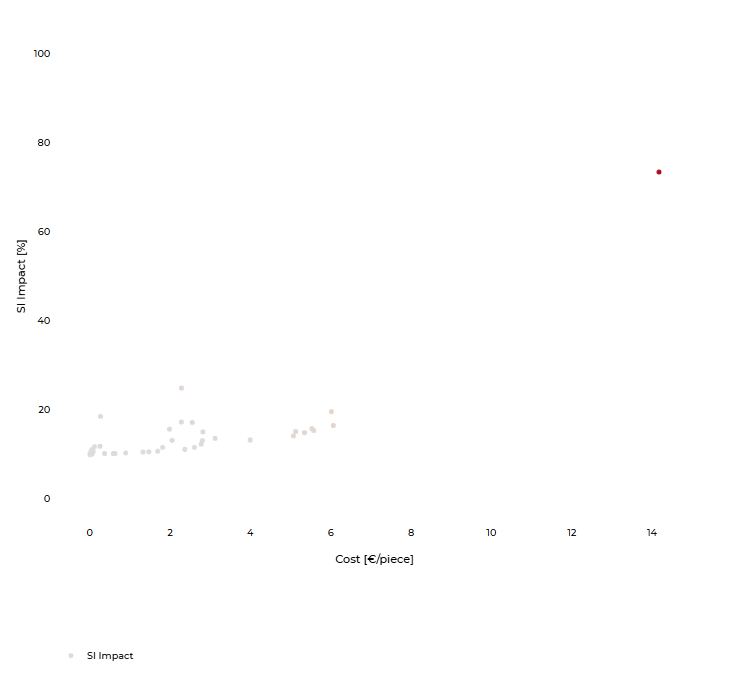
The scatter plot illustrates the relationship between cost and SI. Each point on the chart represents an observation, where an observation refers to a specific combination of parameters that define a complete operating configuration of the plant.
On the right side of the page, the best and worst parameter combinations in terms of SI and cost are displayed. This helps identify the most effective ways to operate the plant in order to achieve both low production costs and high sustainability.
Was this helpful?