

OEE Trend
OEE, or Overall Equipment Effectiveness, is a key metric used to evaluate the efficiency of production equipment. Within the OEE TREND section, users can track this performance indicator over time, along with its three core components — Availability, Performance, and Quality — across various time ranges. The widget located in the upper-right corner allows users to define the time frame of interest by selecting from predefined periods (such as "Last week," "Last month," "Last 30 days," etc.) or by setting a custom date range. Additionally, it is possible to choose the data aggregation level (daily, weekly, monthly, etc.).
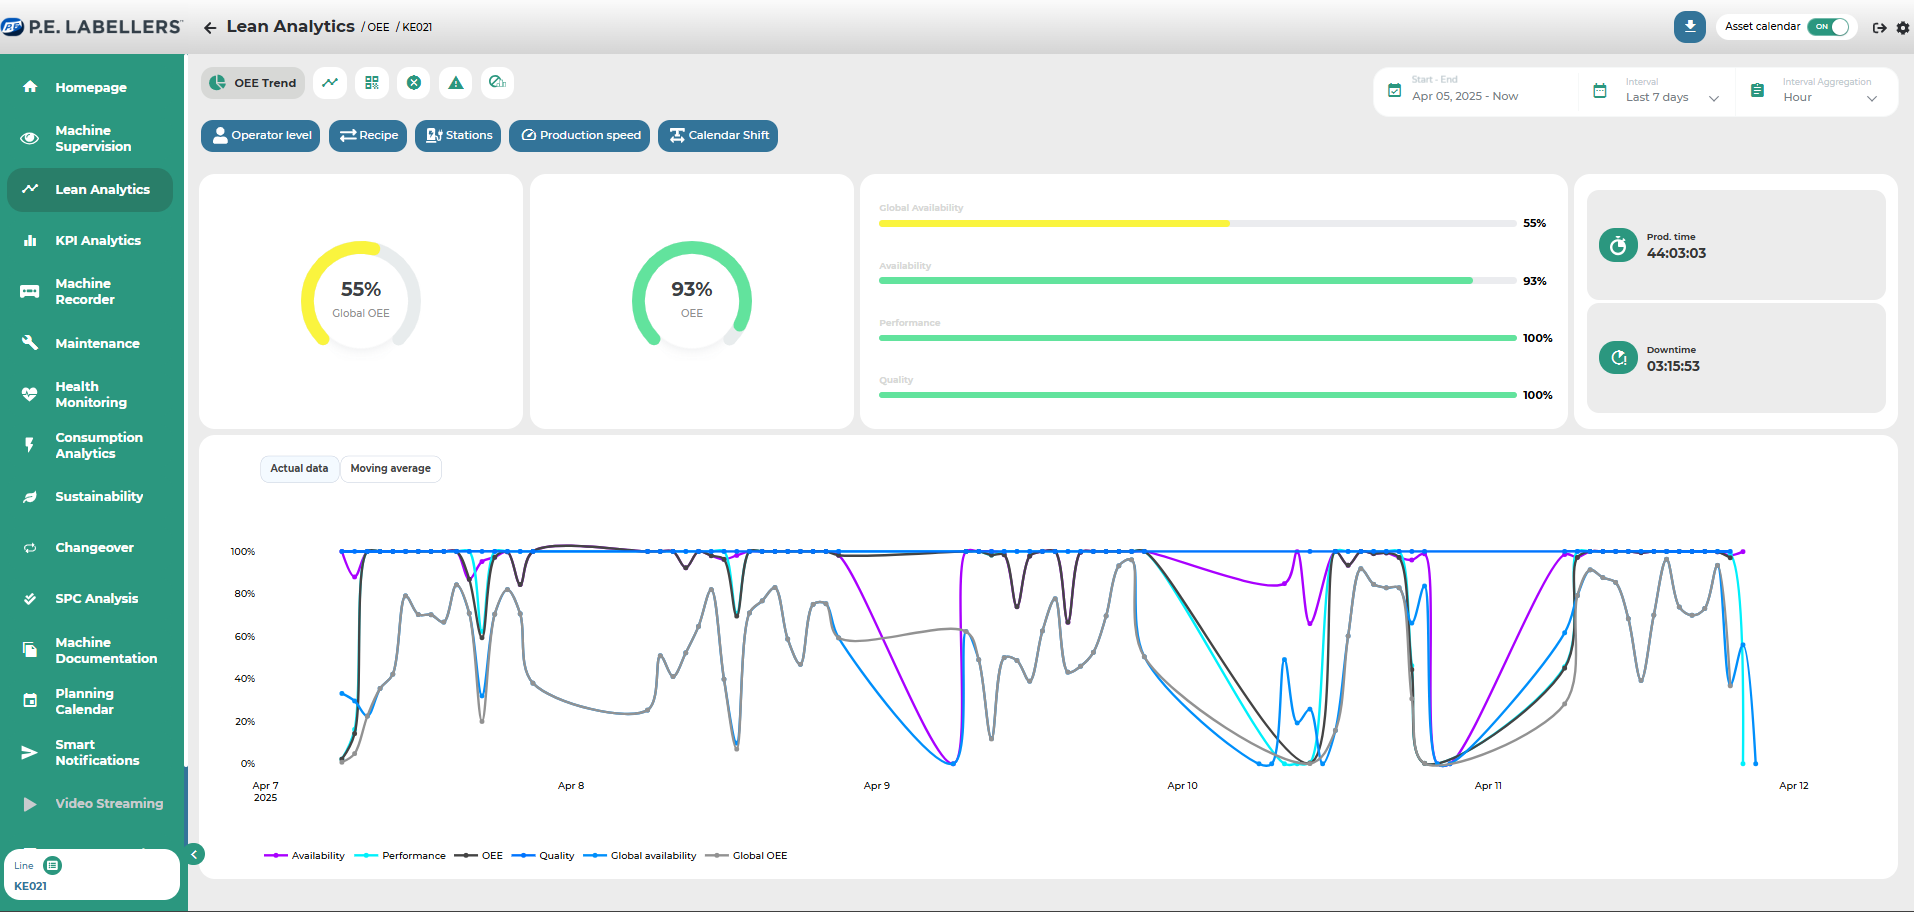
This module is specifically designed to enable a detailed examination of machine or production line efficiency by analyzing OEE and its components over time. The upper part of the dashboard displays the percentage values of OEE and its individual elements, as well as other relevant figures such as productive time and downtime. This high-level overview helps identify which factor most significantly affects overall productivity, thereby allowing users to focus their efforts on the most critical area.
Each OEE component can be individually displayed or hidden in the graph by using the selection panel (as shown in the figure above). The chart also supports interactive features such as zooming, which activates an adaptive zoom function. This feature dynamically adjusts all displayed data within the dashboard to reflect the selected time range.
In the field of technical analysis, moving averages are commonly used algorithms that provide a summarized view of a value’s trend over time. Mathematically, they calculate an “average” over a specific, shifting time window — meaning they only consider the most recent N data points in chronological order.
Was this helpful?