

Alarms Trend
Subsection dedicated to the in-depth analysis of each event, where "event" refers to either an alarm or a notification.
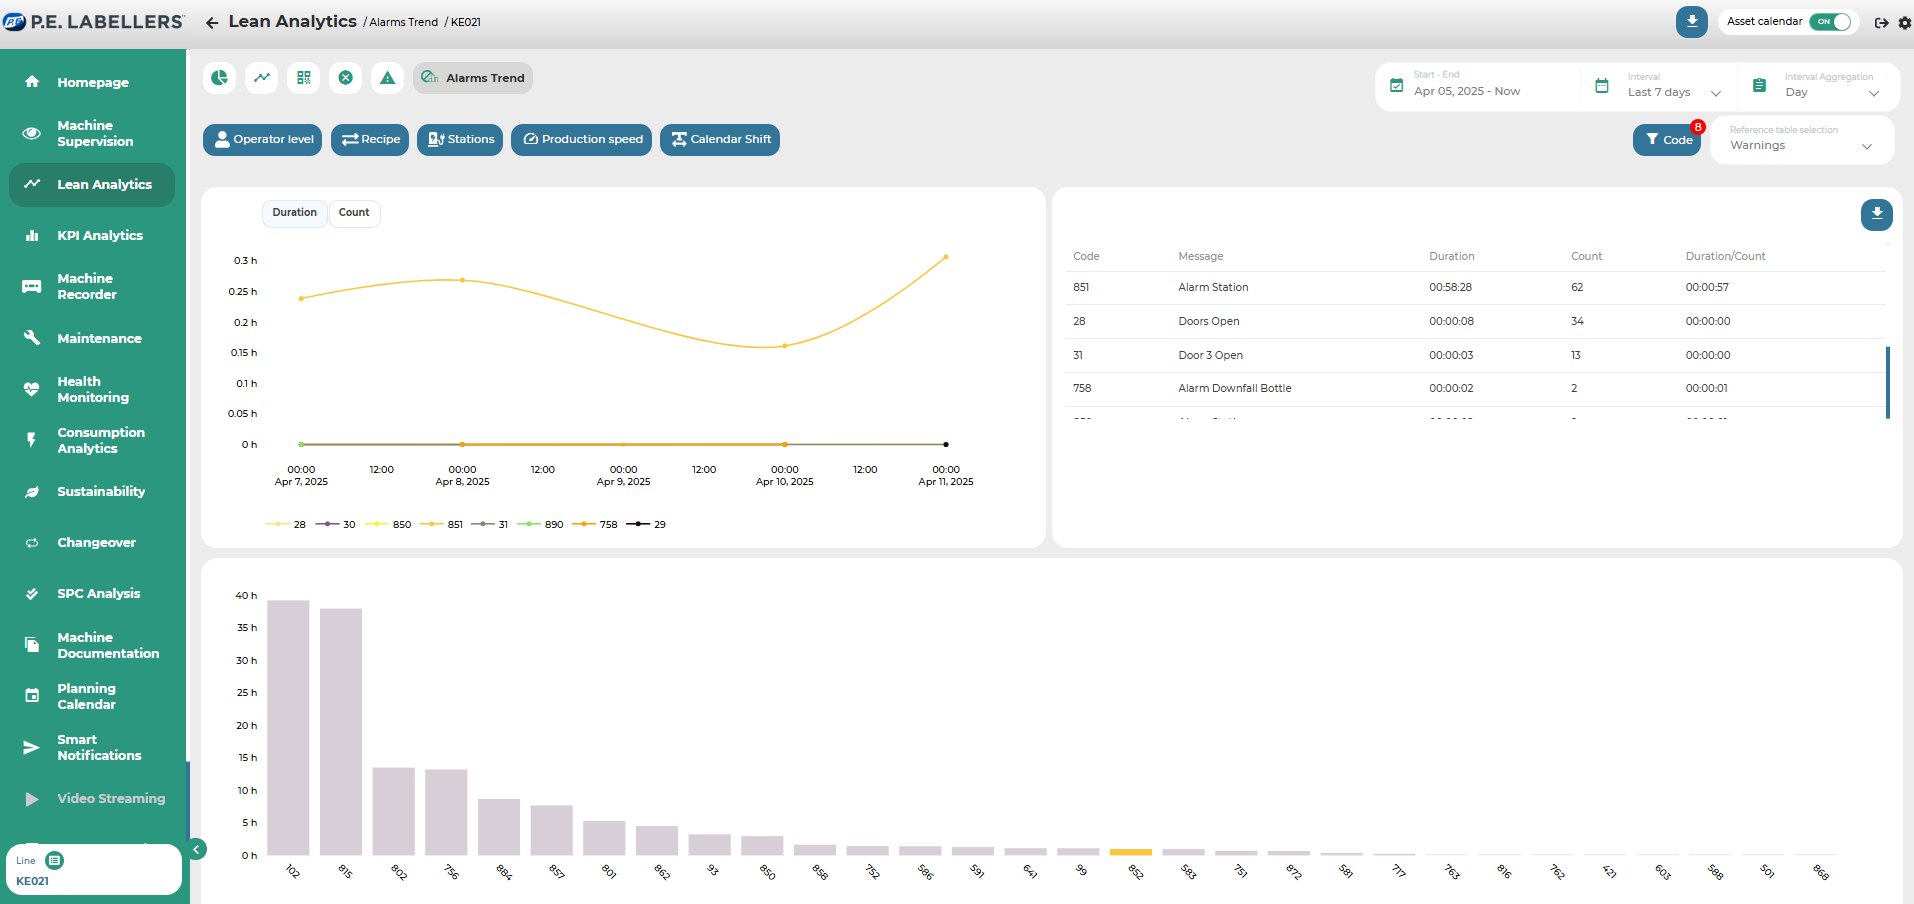
By selecting a bar from the Pareto chart located in the lower portion of the dashboard, the system displays a detailed trend graph of the selected event over the chosen time period. Key information is also provided, including: event code, message, duration, count, and duration/count ratio.
Multiple events can be selected simultaneously to compare their trends and impact.
Within the page, a selection menu allows the user to switch the data set used for analysis. Depending on the selected option, it is possible to view either alarm data or notification data.
Was this helpful?