

Failure Analysis
This section provides a range of information on component failures, allowing for more effective coordination of maintenance activities.
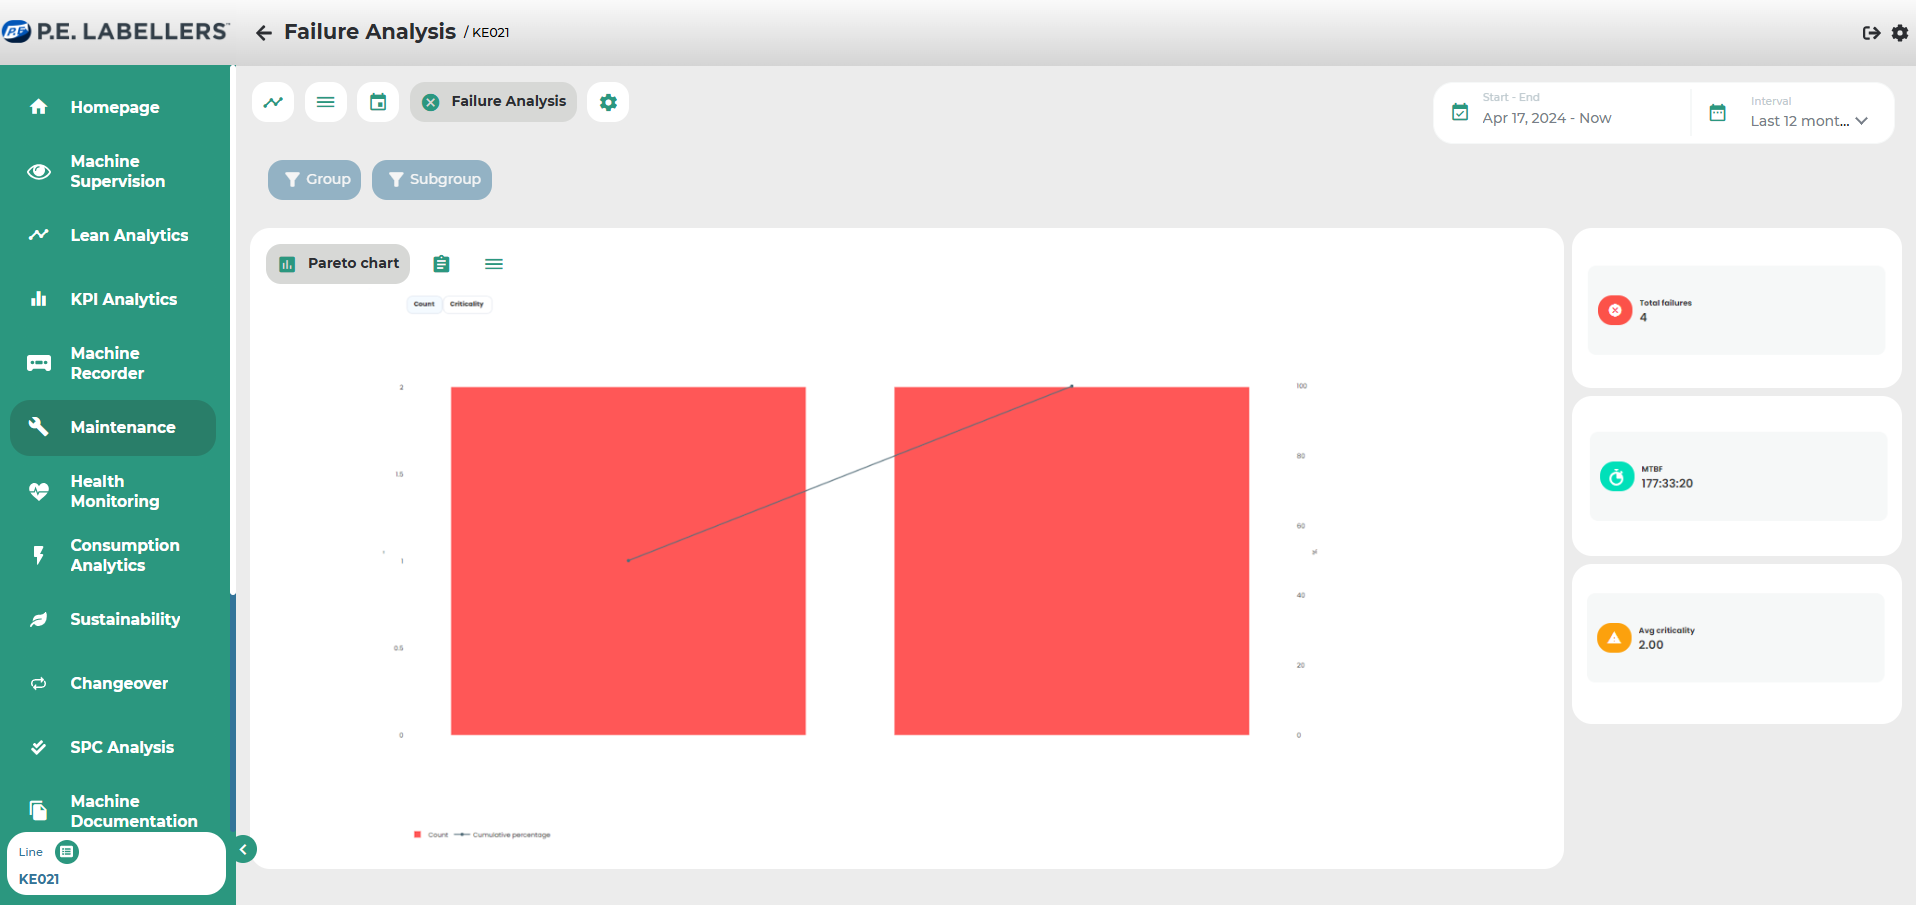
In particular, it is possible to view the failure analysis through:
Pareto chart: a graphical representation of the most significant failures, ordered by decreasing impact or frequency
Table: tabular data providing detailed information on component failures
FMECA events
Additionally, all information can be filtered by group and subgroup by selecting the corresponding tabs.

Was this helpful?