

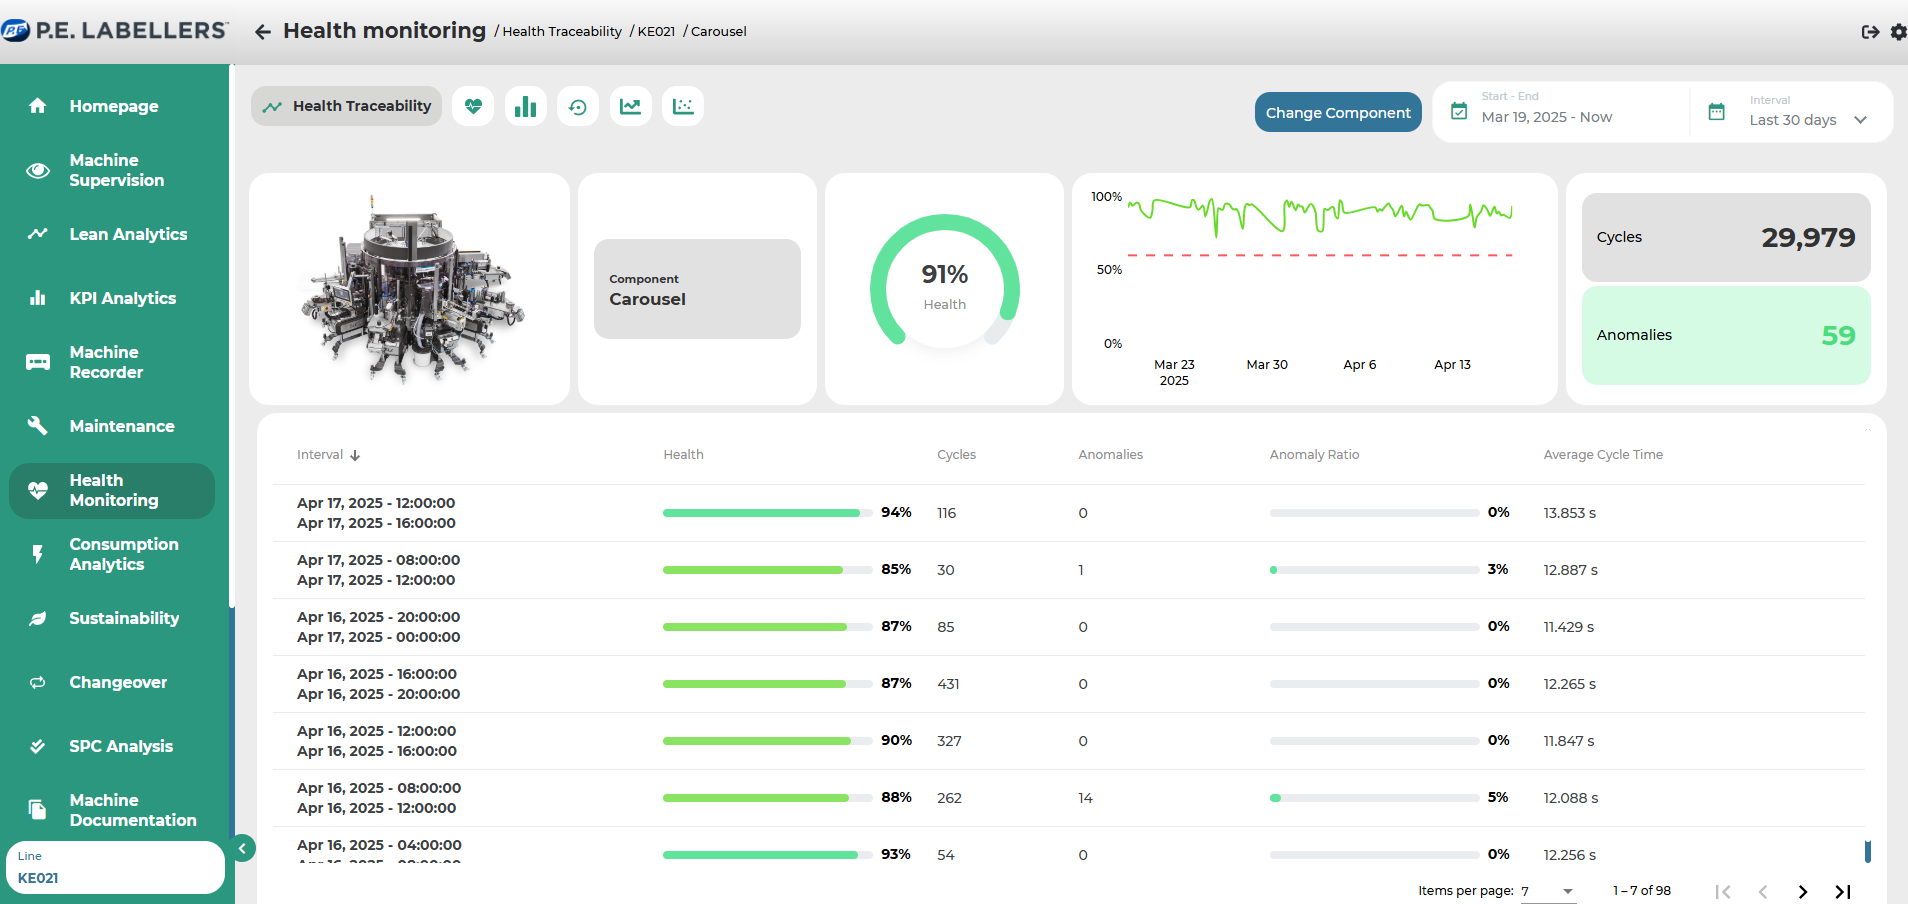
Health Traceability
On the page, preliminary indications are provided based on the selected time frame and selected component regarding:
Average health status of the component/unit/station (through a gauge with dynamic coloration from red to green, depending on the percentage of health rate)
Specific health status values of individual stations recorded during the examination period in the form of a linear graph and reference to a threshold
Number of evaluated episodes
Number of anomalous episodes detected with dynamic coloration from red (>x+1 anomalies), yellow (>=x anomalies) to green (<x-1 anomalies).
"Threshold" refers to the set value below which the health rate becomes critical during the set-up phase. The value x of anomalies above which the system registers criticality is established during the set-up phase.
Was this helpful?