

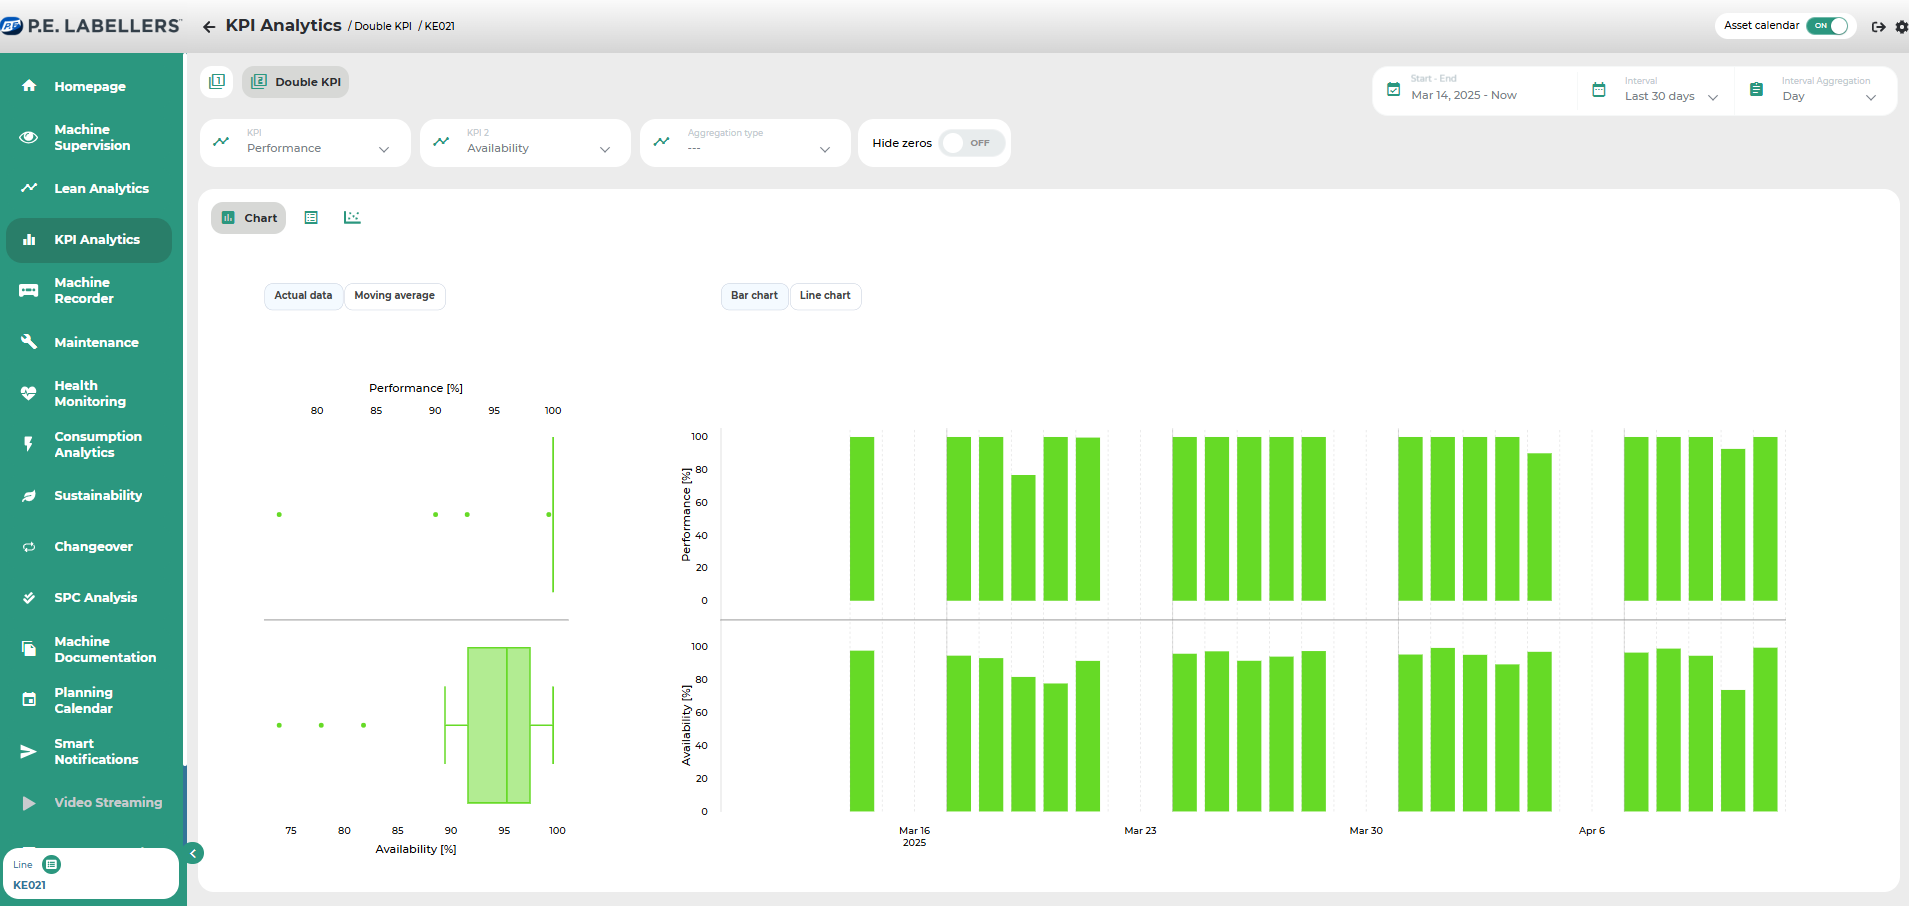
Double KPI
Subsection that allows comparing two different KPIs against each other, also based on a selected aggregation factor, to identify potential correlations between them.
The default visualization is a scatter plot, but two additional visualization formats are also available: both as charts and tables.
Scatter Plot View (default visualization)
Chart View
Table View
The aggregation and filtering functionalities are the same as those in the Single KPI section. Please refer to the Single KPI chapter for more details.
Was this helpful?