

SPC Analysis 2D
Through this page, it is possible to simultaneously monitor the progress of two types of conformity checks carried out on the production of the selected machine.
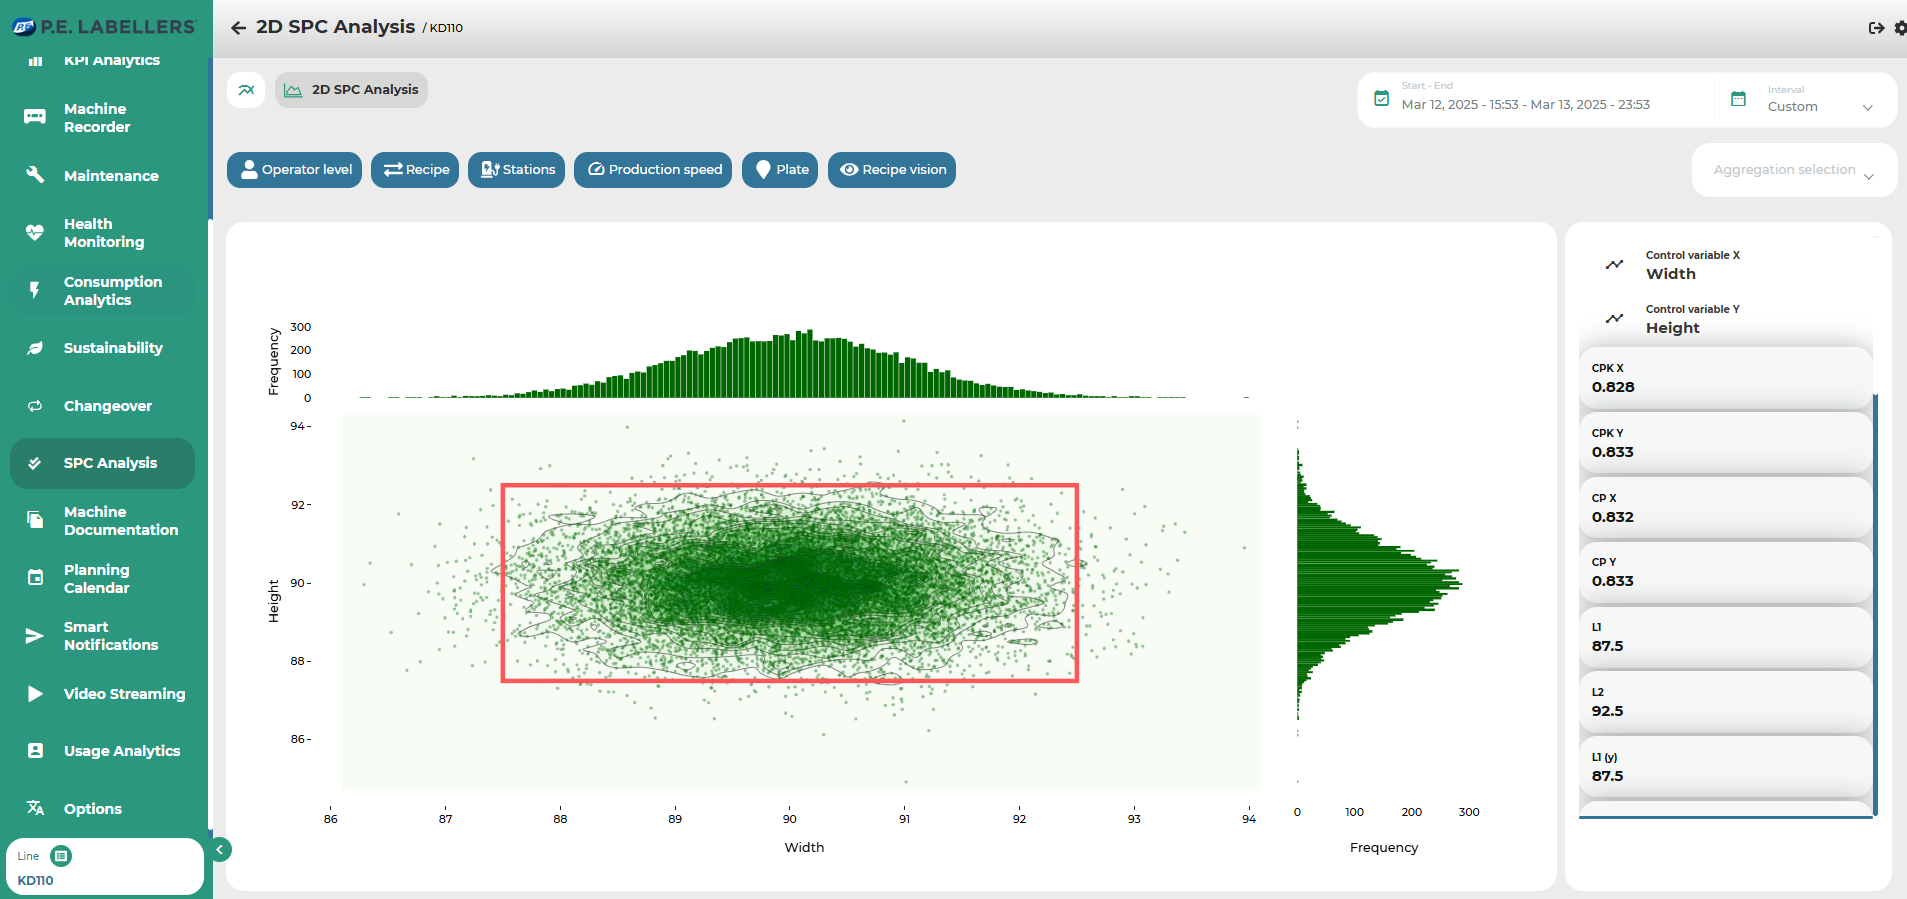
In the central part of the view, a Density Plot graph is shown, which allows for the analysis of how much product has been produced for each possible value of a constraint. Each point in the graph corresponds to a combination of values taken by the two controls. The axes represent the two dimensions or variables being analyzed. The contour lines (or curves) indicate the areas of data density. Contours closer to the center represent areas with a higher concentration of data points, while the outer contours represent areas of lower density. The graph uses a color scale to highlight data density, where darker or more intense colors indicate areas with a higher concentration of data, and lighter colors indicate areas of lower density. Additionally, the graph shows the graphical representation of the constraints being used for the analysis.
On the sides of this graph, two histograms are shown, allowing for insights into the distribution of individual variables along the X and Y axes. The height of a bin is determined by the number of produced elements that fall within the constraint considered by the bin.
On the lateral side, general information about the analysis is provided, such as the number of produced units, the number of units considered as scrap, the type of applied constraint, the limit values for that constraint, the mean value, and the standard deviation of the data, etc. Each of these pieces of information is calculated using both the data from the constraint on the X-axis and the data from the constraint on the Y-axis.
The page also includes some selectors that allow the modification of the analysis parameters.
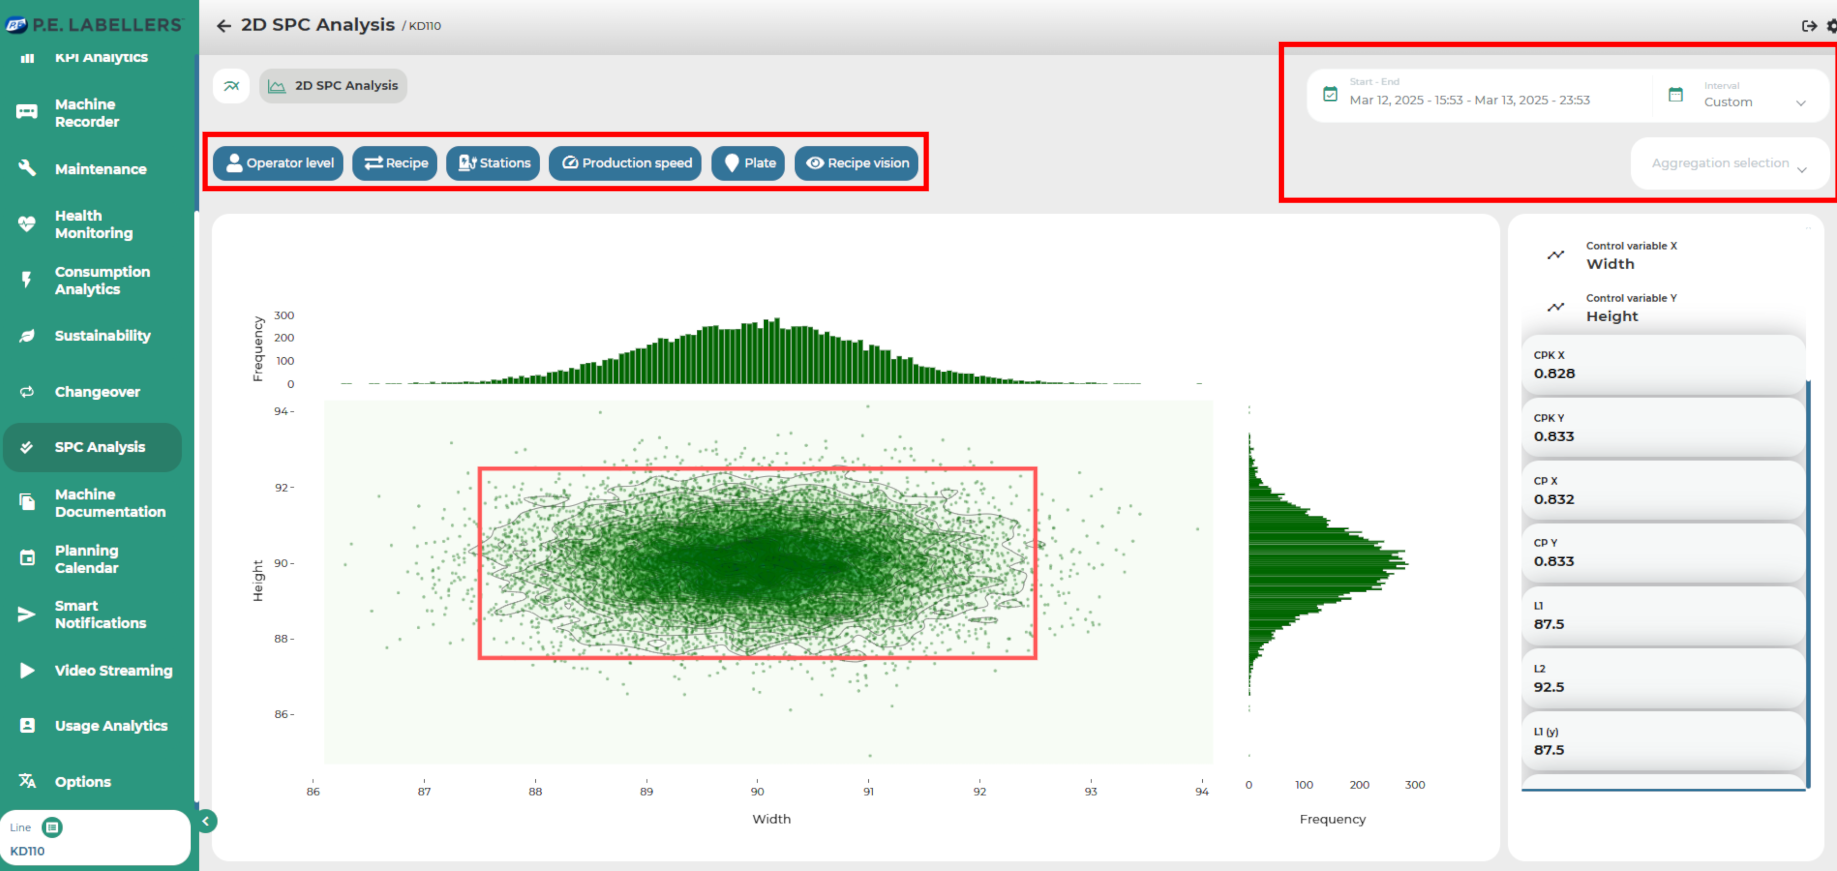
In the right part of the window, there is a selector that allows choosing the time interval within which to perform the analysis. It should be noted that, for a given interval, the application assumes that the constraints controlled along a certain dimension within the selected time period are of the same type. If this condition is not met, the application assumes that the constraint valid for all data in the interval is the last one in the interval itself. The analysis will be performed based on that constraint, so it is necessary for the user to verify the requested time intervals. If a time interval is selected where, for a single axis, different constraints are active, the user will be notified of this via a graphical element.
In addition to being able to select the time interval, there is also the option to select the sub-machine for which the analysis is to be performed. This option is valid only for multi-machine assets.
In the left part, some other selectors are present. By using the "Variable" control, the user will be prompted to choose the type of control to analyze. There are also selectors available that allow filters to be applied to the data considered in the analysis.
Was this helpful?